
Figure 4.
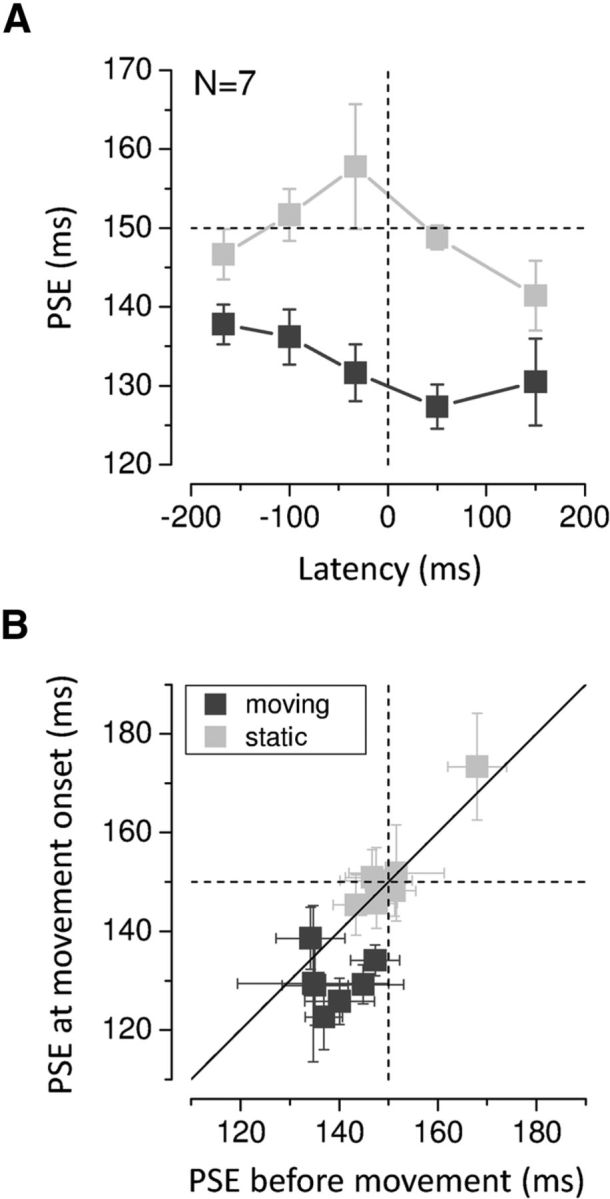
A, Average PSEs as a function of stimulus presentation time. The dashed horizontal line indicates physical duration; the dashed vertical line indicates movement onset time. Error bars represent SEM. B, PSEs around movement onset time (average ± SD latency = 35 ± 8 ms) plotted against those early before movement (average ± SD latency = −216 ± 21 ms) for the moving (black) and stationary hand (light gray; results for all subjects). The PSEs early before movement were calculated on the 60 trials with the earliest stimulus presentation times collected for each subject (starting from −300 ms), whereas the PSEs around movement onset included 60 trials up to stimulus latencies of 75 ms. The vertical and horizontal dashed line represents physical duration. The diagonal shows equal perceived time early before and around movement onset. Error bars represent SEM.