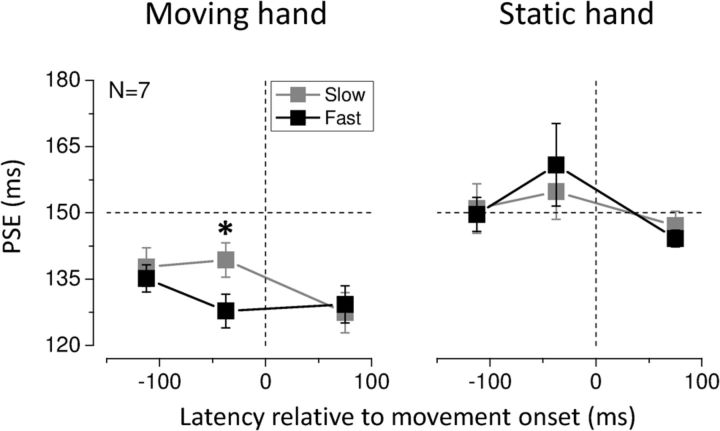
Figure 5.
Average PSEs for stimuli presented to the moving and stationary hand as a function of stimulus presentation time, when fast and slow hand movements were executed. The dashed horizontal line indicates veridical duration; the dashed vertical line indicates movement onset time. Error bars represent SEM. The star represents statistical significance (α = 0.05) of the difference between PSEs for fast and slow movements when the center of the test intervals fell within −75 and 0 ms (relative to movement onset).

