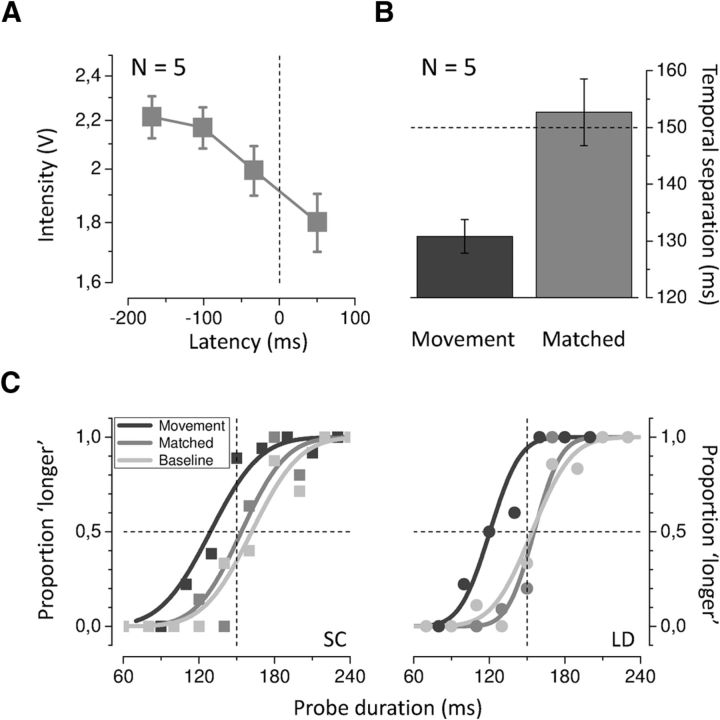
Figure 7.
Control experiment A, Average PSEs for the intensity-matching experiment plotted as a function of stimulus presentation time with respect to hand force onset. B, Average PSEs for the movement (results from the main experiment, black) and the intensity-matched condition (gray). The PSEs for the movement condition have been calculated in the same latency bin (0–100 ms after force onset) that was used to determine the matching-intensity and then averaged across the same five subjects who took part in the control experiment. The dashed horizontal line indicates physical duration (150 ms). Error bars represent SEM. C, Psychometric functions showing the proportion of trials where the probe was judged to be longer than the test in the movement (black), intensity-matched (gray), and baseline (light gray) condition. Data for two representative subjects (SC and LD; same subjects of Fig. 2) are shown.

