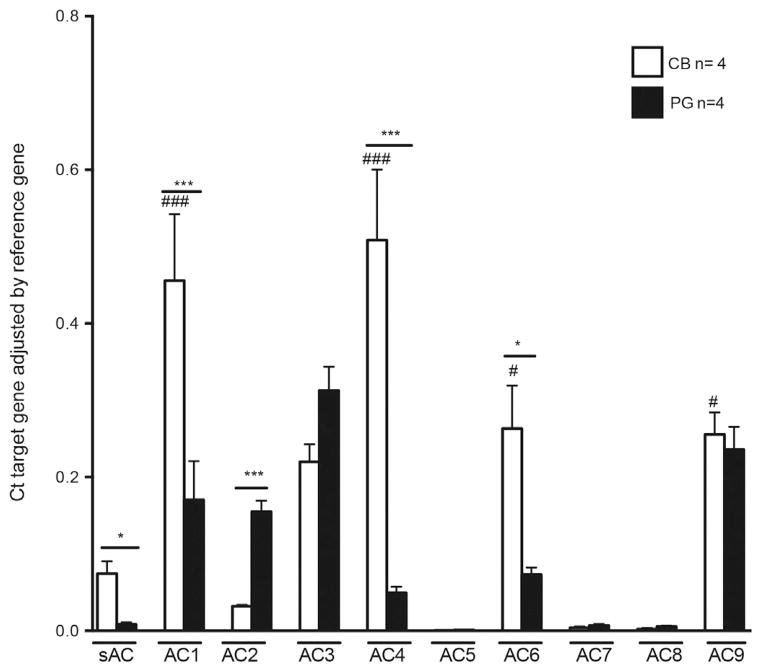
Fig. 1.
tmAC mRNA expression is higher than sAC in the carotid body (CB) and petrosal ganglia (PG). Adenylyl cyclase expression was quantified by qRT-PCR and analyzed by relative quantification to the reference gene based on the threshold cycle (CT, 2ΔCT, where ΔCT = CT,reference – CT,target). Error bars indicate mean ± SEM. Two way repeated measurements ANOVA with Bonferroni post hoc test: *p < 0.05 and ***p < 0.001 for comparison of the same AC isoform between different tissues (CB and PG) and #p < 0.05 and ###p < 0.001 for comparison between sAC and different tmAC in the CB.

