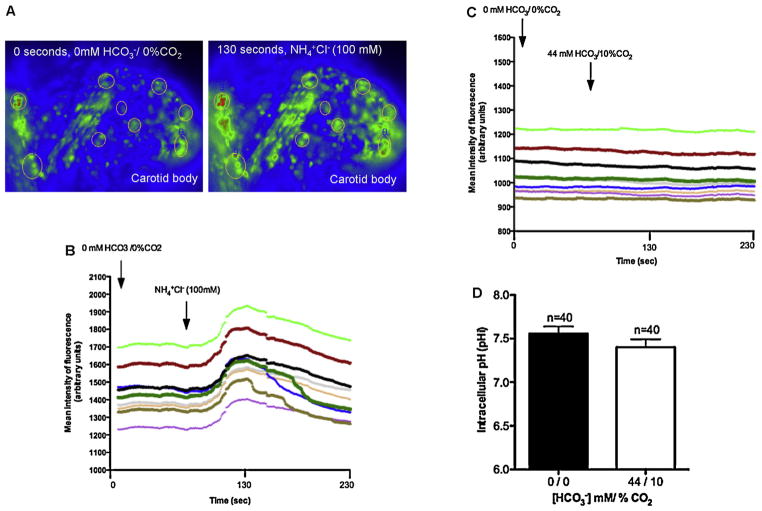
Fig. 2.
(A–D) Changes in HCO3 −/CO2 do not alter intracellular pH (pHi) in the superfused carotid body. (A) Representative photomicrographs of the CB showing changes in BCECF dye fluorescent intensity (pseudocolor) in the ROI captured prior to (left panel) or in response to exposure to NH4+ Cl− for 30 s (100 mM, right panel). Increased green pseudocolour and red areas in the ROI in the right photomicrograph represents increasing areas of fluorescent intensity corresponding to increased pHi. Tracing below photomicrographs was obtained prior to, during and after exposure to NH4+ Cl− (100 mM). (C) Representative tracing from one experiment showing no change in mean fluorescence intensity (pHi) for the ROIs in the CB when the superfusate was changed from 0 mM HCO3−/0%CO2 to 44 mM HCO3−/10%CO2. (D) Composite data obtained from four different preparations, with a total of different 40 ROIs showing no change in mean fluorescence intensity. Error bars indicate mean ± SEM. A control experiment with NH4Cl showed that there was a distinct change in fluorescent intensity CB cells (A and B). Furthermore, incremental changes in fluorescent intensity associated with changes in extracellular pH (6.5–8.0) were observed using the nigericin (10 μM)/high K+ method to construct calibration curves. No variation in pHi associated with changes from 0 mM HCO3−/0%CO2 to 44 mM HCO3−/10%CO2 within each selected region of the whole CB was observed (C and D), confirming that pHi is maintained in isohydric hypercapnia.

