
Fig. 6.
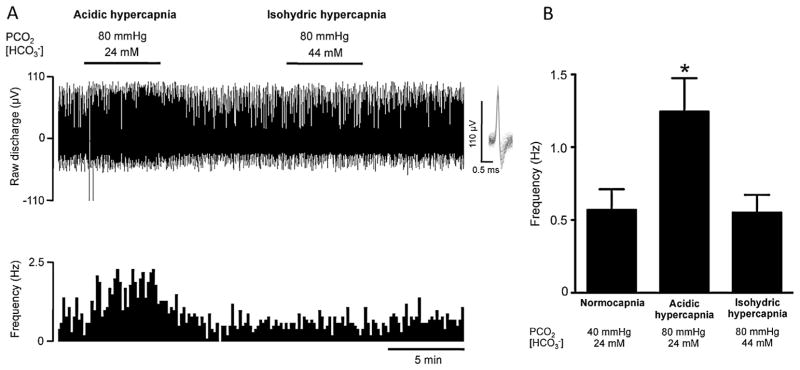
Acidic hypercapnia but not isohydric hypercapnia induces chemoafferent stimulation. (A) An example extracellular recording showing raw chemoafferent discharge (upper) and frequency interval histograms in 10 s groups (lower), recorded in control normocapnia, acidic hypercapnia and isohydric hypercapnia. Overdrawn action potentials are shown inset to demonstrate the single fiber discrimination used to obtain the frequency histograms. (B) Mean frequencies measured in normocapnia, acidic hypercapnia and isohydric hypercapnia. A significant elevation in single fiber discharge frequency was observed in acidic but not isohydric hypercapnia. Error bars indicate mean ± SEM. * denotes p < 0.05 compared with normocapnic frequency; one way repeated measures ANOVA with Dunnett’s post hoc analysis.