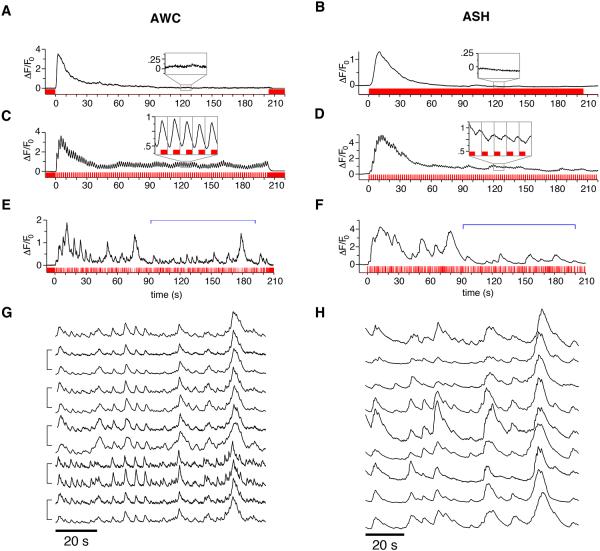
Figure 1. AWC and ASH Respond Reliably to Simple and Complex Odor Patterns.
Representative calcium transients (black) of AWC or ASH neurons expressing GCaMP3; stimulus input sequences are shown in red. For methods see Figure S1.
(A,B) Step responses. (A) AWC response to odor removal after a five minute pre-exposure to 9.2×10⁻⁴ M isoamyl alcohol. (B) ASH response to addition of 1 M glycerol.
(C,D) Flicker responses. (C) AWC response to a flickering on/off 9.2×10⁻⁴ M isoamyl alcohol stimulus with a 1 s pulse length, following five minute pre-exposure to isoamyl alcohol. (D) ASH response to a flickering on/off 1 M glycerol stimulus with a 1 s pulse length. Insets, magnified views of 10 s intervals after the response reached steady-state, stimulus in red. Gray vertical lines divide the inset graphs into 2 s epochs aligned to stimulus transitions.
(E-H) Responses to pseudo-random m-sequence stimuli. (E) AWC response to a pseudo-random on/off 9.2×10⁻⁴ M isoamyl alcohol stimulus following a five-minute pre-exposure to isoamyl alcohol. (F) ASH response to a pseudo-random off/on pattern of 1 M glycerol. (E) and (F) used two repetitions of an m-sequence of pulse length 200 ms, 9-bit sequence. Brackets mark the second repetition, shown for additional neurons in (G) and (H), and used to construct and analyze the L-N model. The m-sequence stimulus input patterns were similar but with inverted sign; note the similar overall shape of the AWC and ASH neuronal responses but sharper temporal resolution in AWC traces. (G,H) Responses of additional AWC (G) or ASH (H) neurons to the same m-sequence as in (E) and (F). Brackets indicate two trials of a single animal, separated by ∼10 minutes. Individual traces were normalized to the peak magnitude within each trace.

