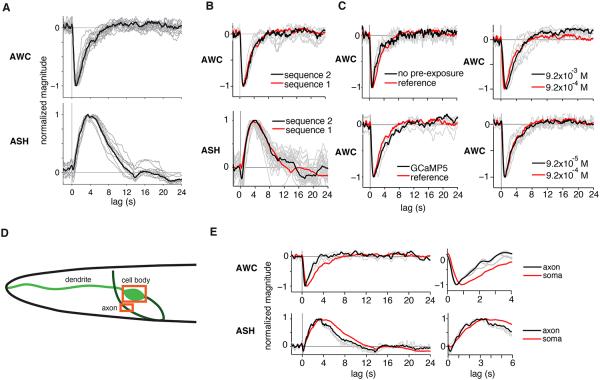
Figure 2. AWC and ASH Linear Filters are Invariant and Robust.
(A) Linear filters inferred from individual input-output records for AWC and ASH neurons (gray) and from trial-averaged input-output records (black).
(B) AWC and ASH linear filters inferred from different m-sequence stimuli (sequence 2) compared to reference sequence from (A). Note the slight difference in ASH filters at late time points; an average of the two filters would likely reduce finite-length trial effects and provide a more accurate estimate of the “true” neural filter.
(C) AWC linear filters derived without odor pre-exposure, using a GCaMP5 indicator, and in response to different isoamyl alcohol concentrations. For concentration analysis of ASH filters, see Figure S3.
(D) Diagram of ASE or AWC anatomy, showing example regions of interest (boxes) for calcium imaging from the soma and axon.
(E) Comparison of linear filters from somatic (red) versus axonal (black) calcium signals in AWC and ASH, with early timepoints magnified at right.

