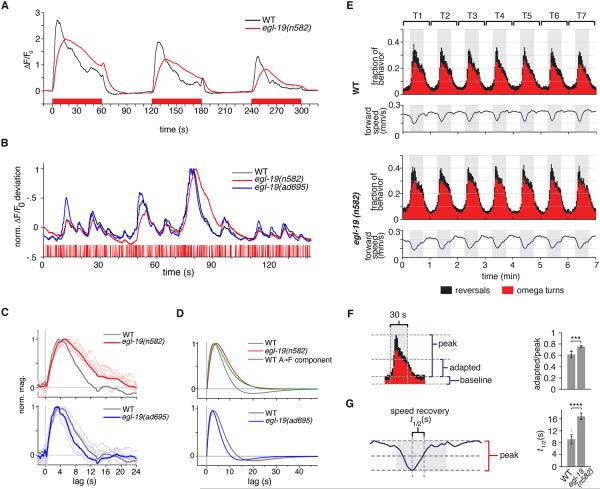
Figure 5. An egl-19 Calcium Channel Mutant Shows Matching Defects in ASH Calcium Dynamics and Behavioral Adaptation.
(A) Average responses of ASH wild type (n=7) and egl-19(n582) (n=23) mutants to 60 s on/off pulses of 1 M Gly, stimulus shown below in red. See also Figures S3 and S5.
(B) Excerpt of trial-averaged responses to 200 ms glycerol m-sequences of ASH wild type (n=10), egl-19(n582) reduction-of-function mutants (n=7), and egl-19(ad695gf) gain-of-function mutants (n=7), stimulus shown below in red.
(C) Linear filter measured from ASH neurons of egl-19(n582) mutant (upper panel) and egl-19(ad695gf) mutant (lower panel) trial-averaged records (thick lines) and individual records (thin lines) compared to wild-type filter (gray).
(D) ODE model filter for ASH from egl-19(n582) mutant (upper panel) and egl-19(ad695gf) mutant (lower panel) trial-averaged records (red, blue) compared to the wild type ODE filter (gray). The egl-19(n582) ODE filter closely matches the ASH wild type fast pathway (A-F) filter from Figure 3D, shown here in green. See also Table S1.
(E) Behavioral analysis of egl-19(n582) avoidance responses to 500 mM glycerol. Reversals (black) and omega turns (red) (upper traces) and speed changes (dark blue line, lower traces) are avoidance behaviors elicited upon encountering the high-osmolarity stimulus. Results are shown for seven successive 30 s pulses of glycerol (gray) alternating with 30 s of S Basal buffer (white), with behaviors binned every 2 s.
(F,G) The seven pulses from (E) were averaged into a single stimulus-aligned response to 500 mM glycerol (illustrated for WT in left panels) and analyzed in right panels (1420 tracks for WT, 868 tracks for egl-19(n582)). (F) Fraction of animals exhibiting reversal and omega behavior in the last bin of a 30 s pulse period (“adapted”) divided by the maximum fraction exhibiting reversals or omegas in any bin (“peak”) for each of seven consecutive pulses. Error bars indicate s.d., *** P=0.0002, Welch’s two-tailed t-test.
(G) Average time to half-recovery of baseline forward speed after glycerol encounter. Error bars indicate s.d., **** P<0.0001, Welch’s two tailed t-test.

