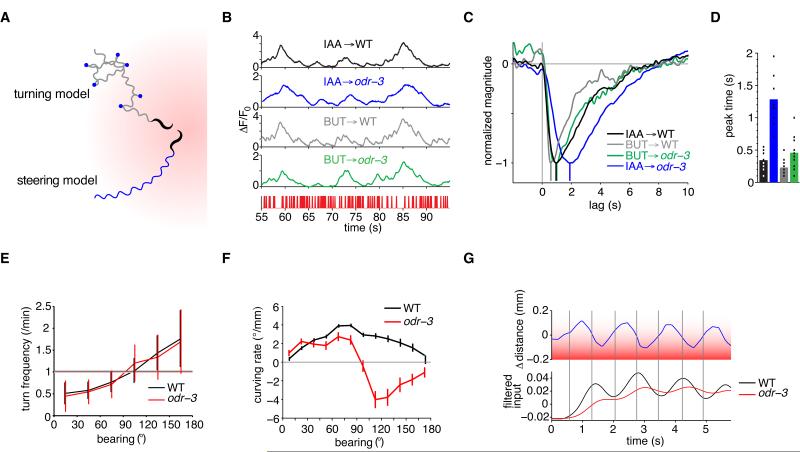
Figure 6. The ODR-3 G-alpha Protein Affects The Rapid AWC Filter and Steering During Chemotaxis.
(A) Schematic of two distinct chemotaxis strategies in an odor gradient, shown shaded red. A biased random walk turning strategy (top path) consists of bouts of forward runs punctuated by sharp, randomly directed turns (blue dots) whose frequency is modulated by the rate of concentration change. The steering strategy (bottom path) uses gradual, directed corrections to the path direction during forward runs to orient the head toward the gradient.
(B) Segment of wild-type and odr-3(n2150) responses to an m-sequence of 9.2×10⁻⁴ M isoamyl alcohol (IAA) and 1.11×10⁻⁵ M butanone (BUT). The stimulus sequence is shown at bottom in red. Note the coarser temporal resolution of the odr-3 IAA response, suggesting that this neuron does not follow stimuli as quickly.
(C) Trial-averaged AWC linear filters for wild type and odr-3 responses to IAA and BUT, normalized to peak. Colors match traces in (B).
(D) Peak times of individual trial filters, corrected for GCaMP3 kinetics, for wild type and odr-3 responses to IAA and BUT. Colors match traces in (C). For C-D, n=11-27 traces per condition. In (D), WT IAA differs from BUT (P<0.001), WT IAA differs from odr-3 IAA (P<0.001), and WT BT differs from odr-3 BUT (P=0.0013) by Welch’s two-tailed t-test. See also Figure S6.
(E) Both WT and odr-3 suppress turning when moving toward the odor (0° bearing) and increase turning when moving away from the odor (180° bearing ), with a positively increasing relationship, the signature of a biased random walk. Turning events were counted across 60 tracks for each strain during a 20 minute assay. Error bars indicate s.e.m.
(F) Curving rate versus bearing reveals a defect in steering in odr-3 relative to WT at bearings ≥ 90 degrees. When moving away from the odor source, odr-3 animals curve in the wrong direction. Data are taken from three assays per genotype, with 10-20 animals per assay. Error bars indicate s.e.m.
(G) Tracked distance from the head of a worm to an odor source, relative to the mean head-to-source distance along the track segment, versus time. This representative track was made during a forward run at a bearing of 90 degrees to an odor source ∼1 cm away (in red). Bottom plot: “perception signals” simulated by convolving the head position with the empirical trial-average isoamyl alcohol ODE filters for AWC in WT (black) and odr-3 (red). The odr-3 perception signal is attenuated and phase lagged relative to WT.

