
Fig. 5.
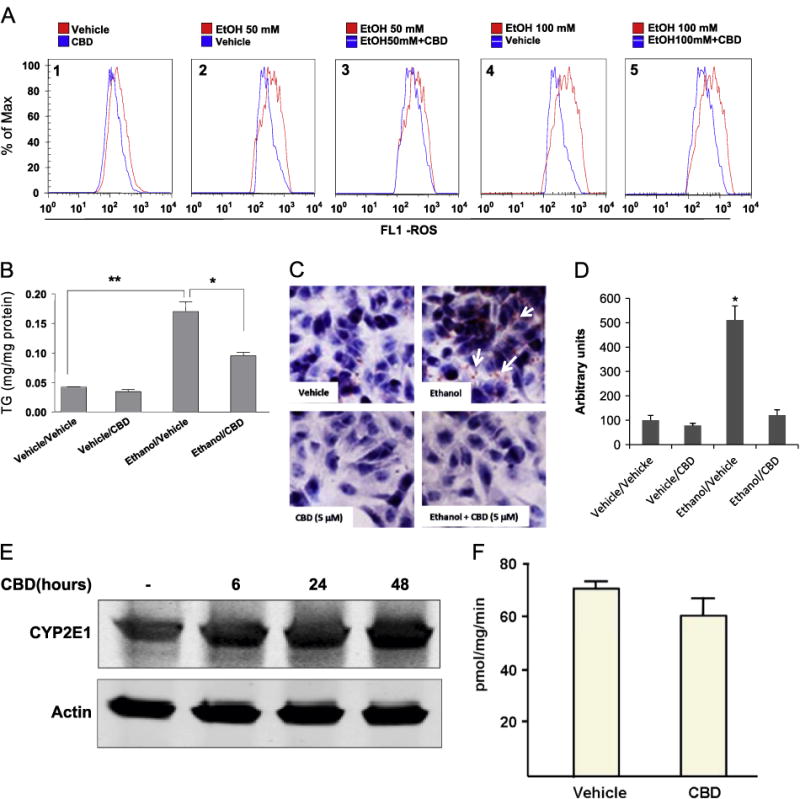
(A) In cytochrome P450 2E1 (CYP2E1)-expressing HepG2 cells, either 50 or 100 mM ethanol treatment increased ROS production (graphs 2 and 4), and CBD partially prevented the increase in ROS (graphs 3 and 5 compared to 2 and 4). ROS were assayed using the Total ROS Detection Kit. The distribution of fluorescence intensity is shown as a histogram, with the y axis indicating the percentage of cells in the total population displaying the specific fluorescence intensity shown on the x axis. (B and C) In vitro 100 mM ethanol treatment increased lipid accumulation in CYP2E1-expressing HepG2 cells. (B) TG levels, expressed as mg/mg protein; *p < 0.05, **p < 0.01. (C) Oil red O staining showing that CBD prevents this lipid accumulation. (D) Quantification of oil red O staining was carried out using the ImageJ program. Staining in the vehicle/vehicle group was taken as 100, and staining of all other groups was expressed relative to the vehicle/vehicle group. *p < 0.05 compared to vehicle/vehicle group. (E and F) CYP2E1 protein expression and catalytic activity were assayed 48 h after the last treatment with CBD. CBD itself does not have any effect on either CYP2E1 protein expression or CYP2E1 activity.