Figure 3.

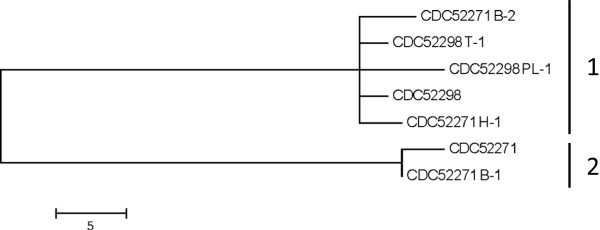
SNP analysis of strains isolated from outbreak #5. Core SNPs were identified using kSNP and a maximum parsimony tree of the core SNP matrix is shown. The sequences cluster into two groups as indicated in the figure.

SNP analysis of strains isolated from outbreak #5. Core SNPs were identified using kSNP and a maximum parsimony tree of the core SNP matrix is shown. The sequences cluster into two groups as indicated in the figure.