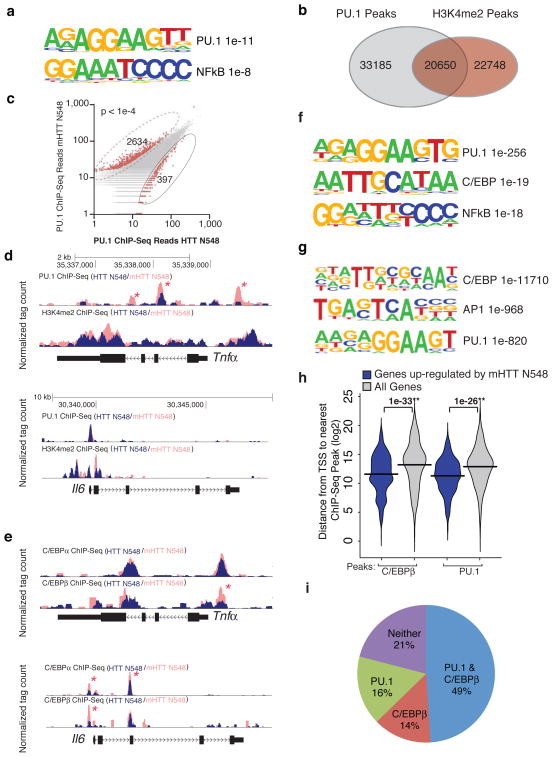
Figure 2.
Mutant Huntingtin promotes pro-inflammatory gene expression via PU.1 and C/EBPs. (a) Motif enrichment in promoters of up-regulated genes in BV2 microglia expressing mHTT N548 in comparison to HTT N548. (b) Venn diagram representing the overlap between PU.1 peaks and H3K4me2 peaks in BV2 cells expressing HTT N548 as detected by Chip-Seq. (c) Scatter Plot of normalized tag counts for PU.1 peaks detected in microglia cell lines overexpressing wild-type vs mutant Huntingtin (data points color-coded red indicate >4 fold difference, p-value < 1e−4) (d) PU.1 and H3K4me2 Chip-Seq read density from BV2 microglia overexpressing wild-type vs mutant Huntingtin at the Tnfα and Il6 loci. Asterisks denote differential PU.1 binding. (e) Motif enrichment at PU.1 peaks specific for BV2 cells expressing mHTT N548. (f) C/EBPα,β Chip-seq read density from BV2 microglia overexpressing wild-type vs mutant Huntingtin at the Tnfα and Il6 loci. Asterisks denote differential C/EBP binding. (g) Motif enrichment at C/EBPβ peaks in BV2 cells expressing mHTT N548. (h) Distribution of distances from either mHTT N548 up-regulated genes’ promoters or all promoters to the nearest C/EBPβ and PU.1 Chip-Seq peaks. (i) Pie diagram representing the fraction of genes up-regulated by the presence of mHTT N548 with a C/EBPβ and/or PU.1 peak within 5kb of the TSS.

