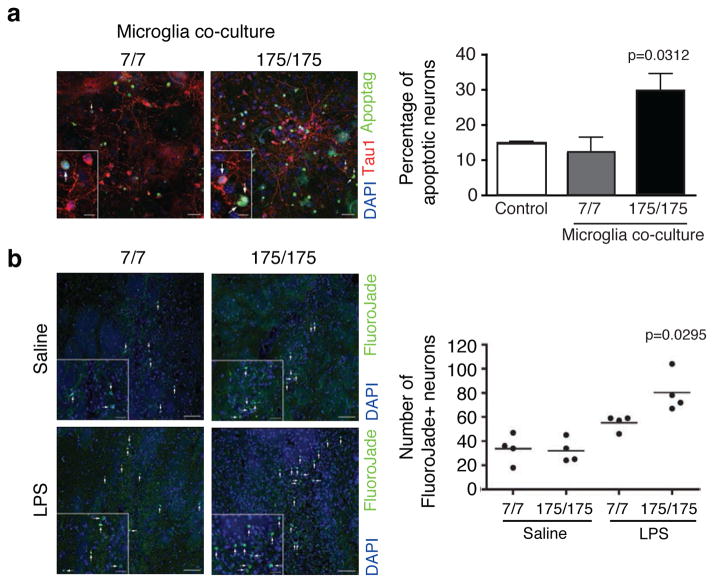
Figure 6.
Effect of mutant Huntingtin expressing microglia on primary neurons ex vivo and in vivo. (a) TUNNEL assay for neurons/astrocytes/microglia co-culture in presence of primary microglia from wild-type Hdh7/7 or homozygous mutant Huntingtin knock-in mice (Hdh175/175). Arrows in representative pictures for each condition point to apoptotic neurons. Insets highlight TUNEL positive neurons. Scale bar: 30μm in panels and 10μm in insets. Quantitative representation of the percentage of Apoptag+ neurons, obtained by the ratio between the number of triple positive cells (Apoptag+, TAU1+ and DAPI+ cells)/total number of double positive (TAU1+ and DAPI+) cells, (mean±sd, n= 3 biological replicates) with pools of microglia from 4 pups per group. Ctrl represents neurons/astrocytes co-cultured without microglia added. p value was determined by one-tailed paired student t-test. (b) FluoroJadeB staining of coronal brain sections from wild-type (Hdh7/7) or homozygous mutant Huntingtin knock-in mice (Hdh175/175) injected with saline solution or LPS (5μg). One representative image for each condition is shown (left). Arrows in representative pictures and insets for each condition point to FluoroJadeB+ neurons. Scale bar: 50μm in panels and 20μm in insets. Quantitative representation of the number of FluoroJadeB+ degenerated/dead neurons (right). Each dot represents the number of FlurojadeB+ neurons per mouse (n=4 mice per group, one-way Anova and Tukey’s post-hoc test).

