
Figure 3.
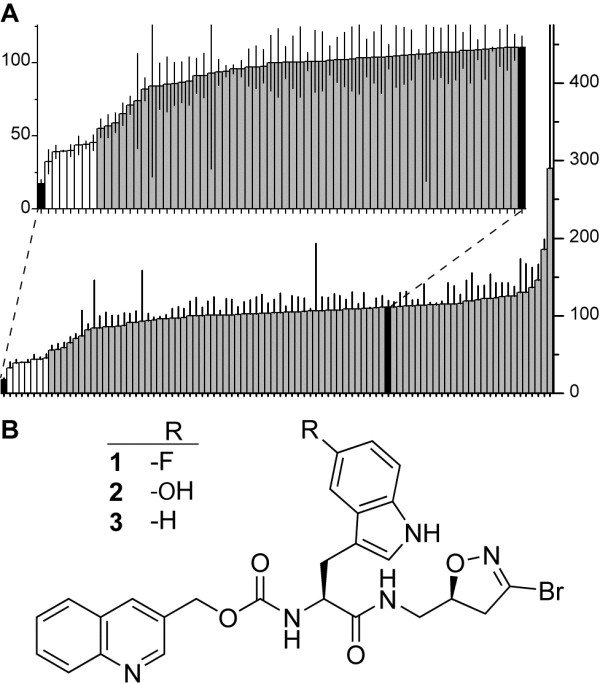
Primary assay results for AgTG3 inhibitor screen. (A) FITC-CAD/plugin-C cross-linking by AgTG3 incubated with 92 TG2 inhibitors, iodoacetamide and DMSO control (black), sorted by fluorescent intensity (arbitrary units). Hits shown in white. (inset) Expanded axes for compounds with I < DMSO, with error. (B) Common chemical structure of top three hits in primary assay.