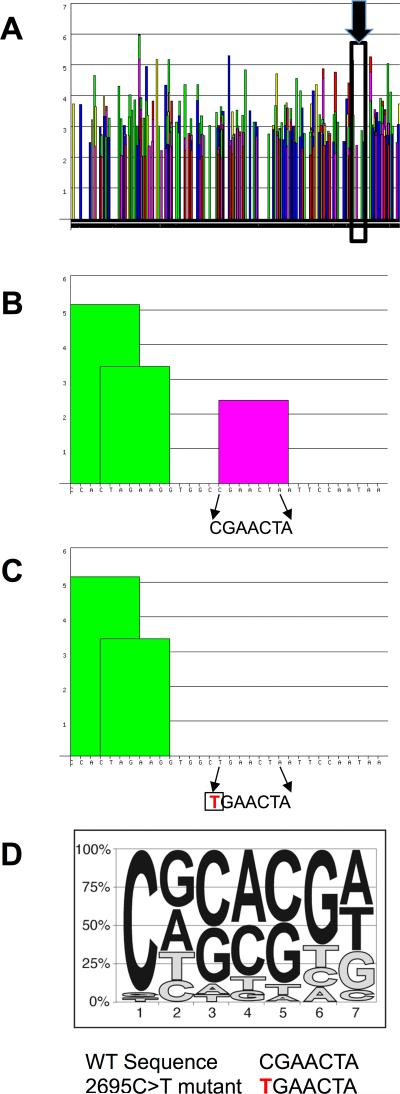
Figure 4. Identification of a splice enhancer in exon 12 of BMPR2.
A) Bioinformatics analysis of the exon 12 sequences identified many potential splice enhancers. Columns represent significance of a particular sequence. Scores above 2 are considered significant. The splice enhancer binding SRSF2 is in the inset area marked by the black box and identified by the black arrow B) Expanded view of the inset area in A. The arrows show the 7 base pairs of an SRSF2 binding site (significant score shown by the pink column) in exon 12. C) When the first base pair of this sequence is mutated from a C to a T (shown in red), bioinformatics analysis predicts elimination of the SRSF2 binding site (graphically represented by lack of any column over the sequence) and skipping of exon 12 in the HPAH patient. D) The consensus sequence of the SRSF2 binding site is shown as a pictogram representation. The height of each letter reflects the frequency of each nucleotide at a given position after adjusting for background nucleotide composition. At each position the nucleotides are shown from top to bottom in order of decreasing frequency. The mutated base, a cytosine, is the most conserved and functionally the most important base of this enhancer.

