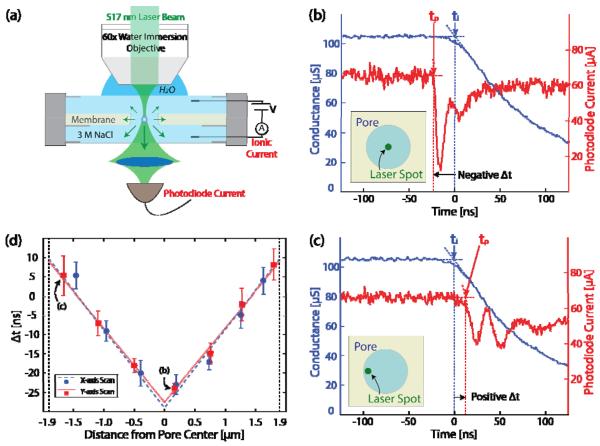
FIG. 3.
(color). (a) Schematic of the optical experiment. (b), (c) Electrical conductance and photodiode current at the onset of a nucleation event with the focused laser at (b) the center and (c) the periphery of the pore. (d) Δt = tp − ti as a function of the laser position for x and y axis scan. Each point contains ten measurements; the error bars show the standard deviations from the mean. The measurements from the data shown in Figures 4(b) and 4(c) were used in the points labeled (b) and (c). Linear fitting is performed for the scans across each axis.

