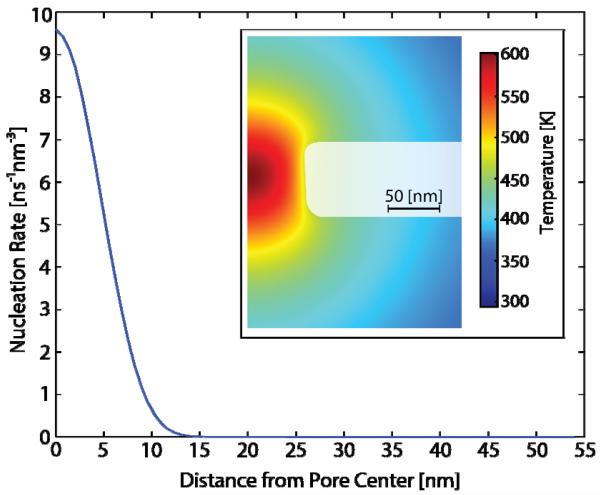
FIG. 4.
(color). The nucleation rate as a function of distance from the center of the nanopore. This corresponds to the temperature computed for the 53.5 nm radius nanopore of Fig. 2 at 10.4 μs, just before bubble nucleation occurs. A contour plot of the temperature at this time is shown in the inset.

