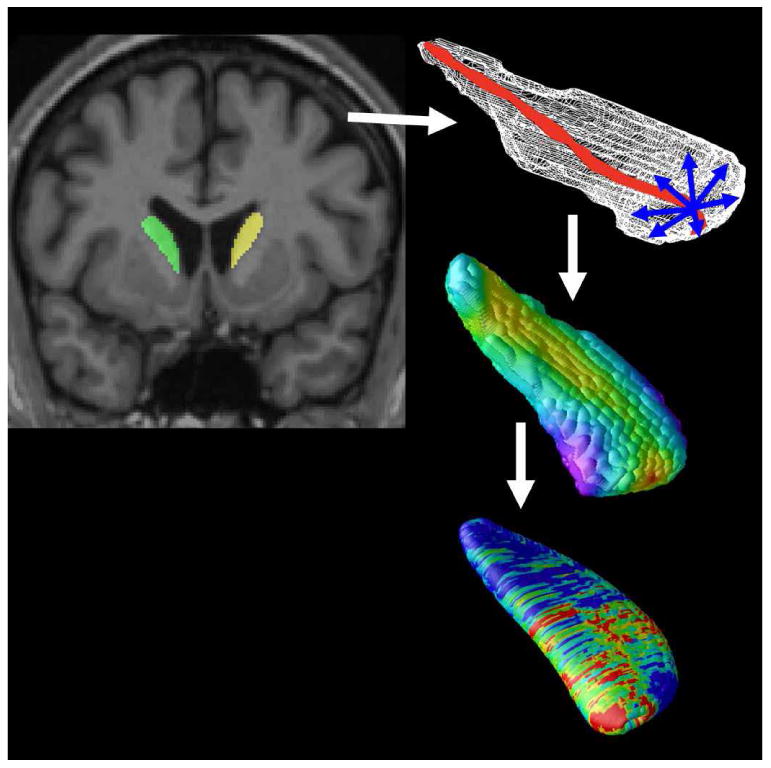
Figure 1. Mapping Atrophy.

After image preprocessing, our Adaboost algorithm automatically segments the caudate nucleus and putamen bilaterally. A central curve (top right) was calculated through the longitudinal axis of each structure and the radial distance to each point in a 3D surface mesh was used as a highly localized measure of atrophy (middle right). P-values are calculated at each surface point (bottom right) showing the significance of differences in radial distances between diagnostic groups or their associations with clinical scores. These maps visualized the profile of local shape differences or their clinical correlates at a point-wise level.
