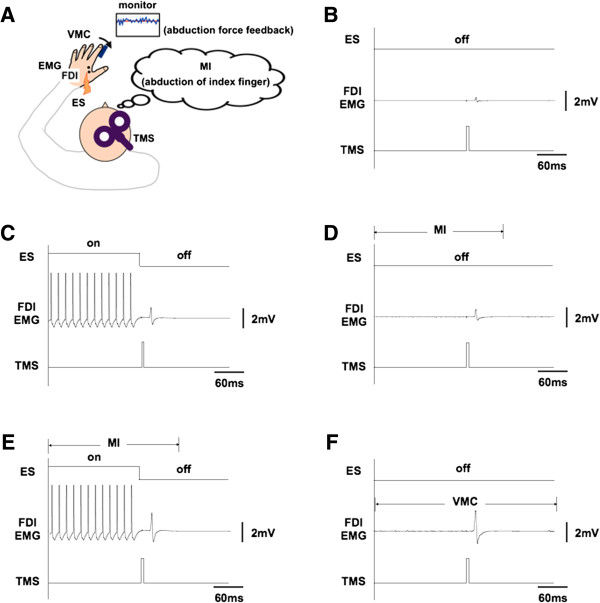
Figure 1.

The experimental setup. Schematic diagram of the experimental setup (A). TMS was applied during (B) rest, (C) electrical stimulation (ES), (D) motor imagery, (E) ES + MI (ESMI), and (F) voluntary muscle contraction (VMC). The spike train, which is shown on the left side of the raw first dorsal interosseous (FDI) EMG, was an artifact of ES (C, E); only the last 12 stimuli are shown.
