
Figure 4. Hmga2GFP mice recapitulate the null phenotype.
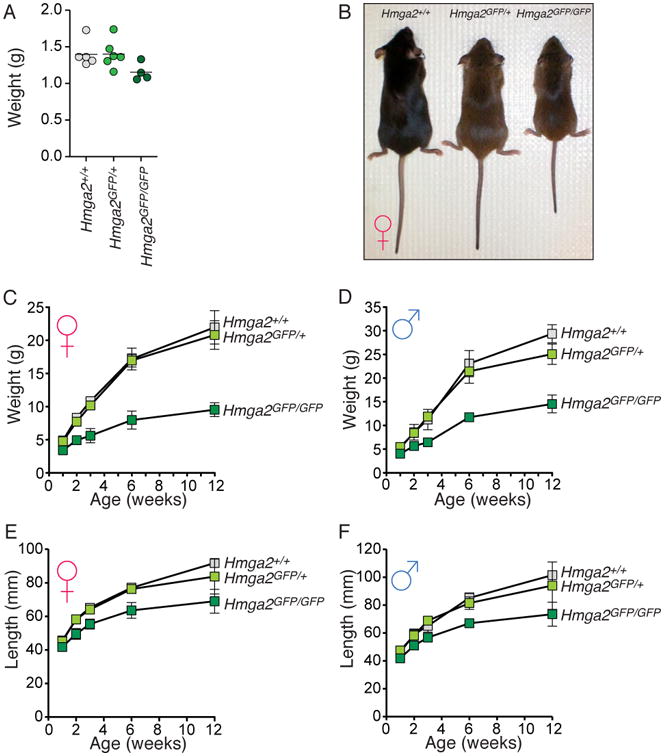
(A) P0 Hmga2GFP/GFP pups are ∼20% smaller than control littermates. Each dot represents a P0 mouse and the bar represents the mean. (B) Photo of 12-week old Hmga2+/+, Hmga2GFP/+, and Hmga2GFP/GFP female littermates. (C, D) Growth curves of female (C) and male (D) Hmga2+/+, Hmga2GFP/+, and Hmga2GFP/GFP mice. Mean +/- SD is shown for each time point. (E, F) Length curves of female (E) and male (F) Hmga2+/+, Hmga2GFP/+, and Hmga2GFP/GFP mice. Mean +/- SD is shown for each time point.