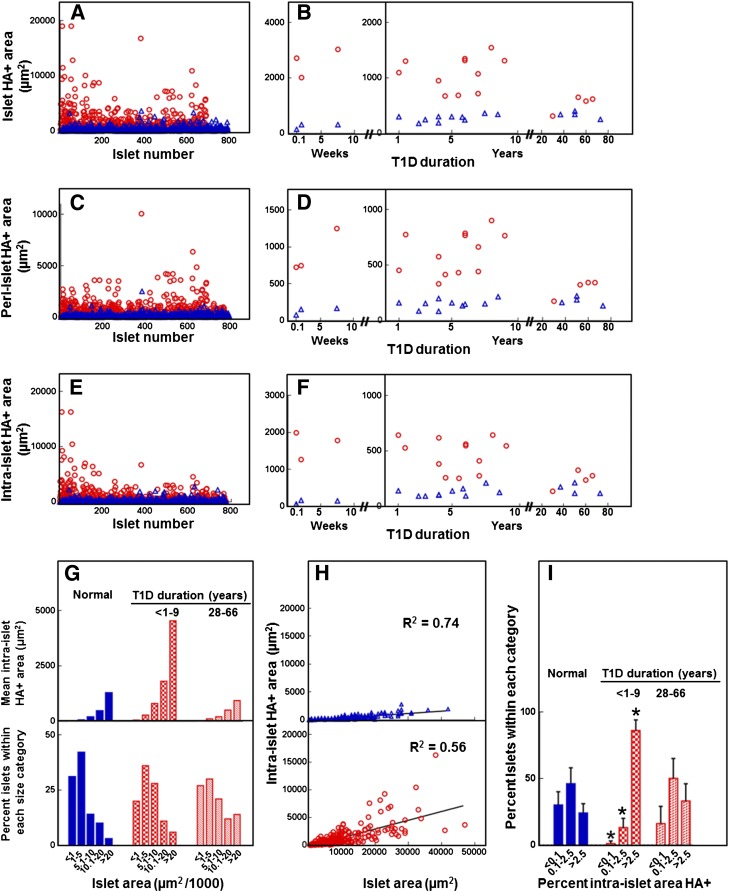
Figure 2.
Quantitative analysis of the HA-positive area in human pancreatic islets. Blue bars and △, normal tissues; red bars and ○, diabetic tissues. Analysis included 794 normal and 775 diabetic islets in tissues of 17 healthy donors and 19 T1D donors with diabetes for ≤9 years (n = 15) and ≥28 years (n = 4). A and B: Morphometric quantification of the islet HA-positive area showing individual measurements obtained from each islet (A) and mean values for each individual donor (B). C and D: Morphometric quantification of the peri-islet HA-positive area showing individual measurements obtained from each islet (C) and mean values for each individual donor (D). E and F: Morphometric quantification of the intraislet HA-positive area showing individual measurements obtained from each islet (E) and mean values for each individual donor (F). G: Mean intraislet HA-positive area (top) measured in the islets falling within each islet area category (bottom). H: Individual measurements of intraislet HA-positive areas plotted as a function of islet area. Spearman correlation coefficients are shown. I: Percent intraislet HA-positive area in normal and diabetic pancreata. *P < 0.0001 vs. normal tissues.

