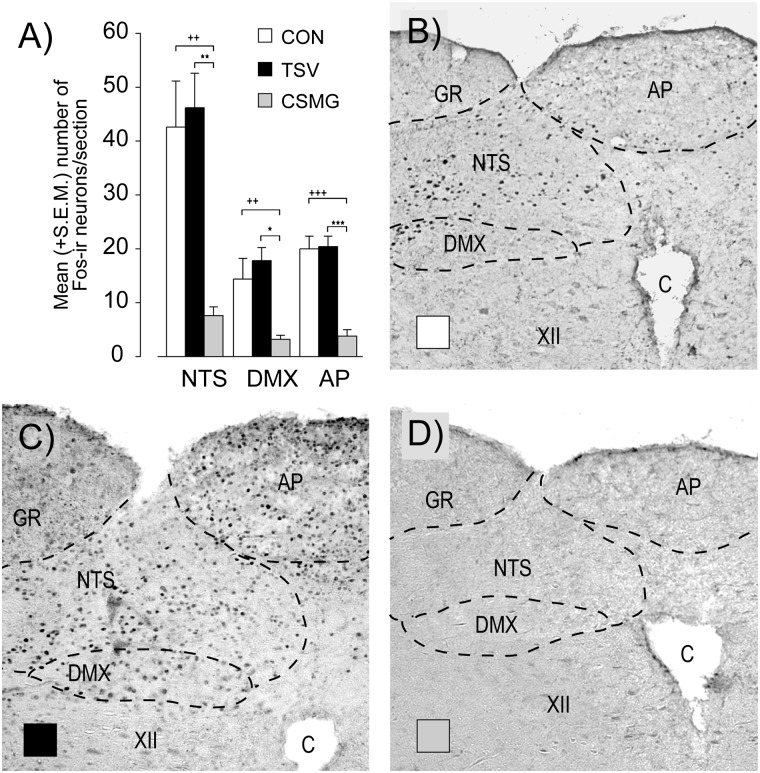
Figure 4.
Fos-immunoreactive neurons within the NTS, DMX, and AP sampled at the end of a slow-onset (−0.05 mmol/L/min) hypoglycemic clamp (105 min) (A). Open bars represent control, closed black bars represent TSV, and closed gray bars represent CSMG. Photomicrographs of representative hindbrain sections for control (B), TSV (C), and CSMG (D) with the AP, NTS, DMX, hypoglossal nucleus, gracile nucleus, and central canal indicated. All values are expressed as mean ± SEM. *P < 0.05; **P < 0.01; ***P < 0.001 for control vs. CSMG. ++P < 0.01; +++P < 0.001 for TSV vs. CSMG. C, central canal; CON, control; GR, gracile nucleus; XII, hypoglossal nucleus.

