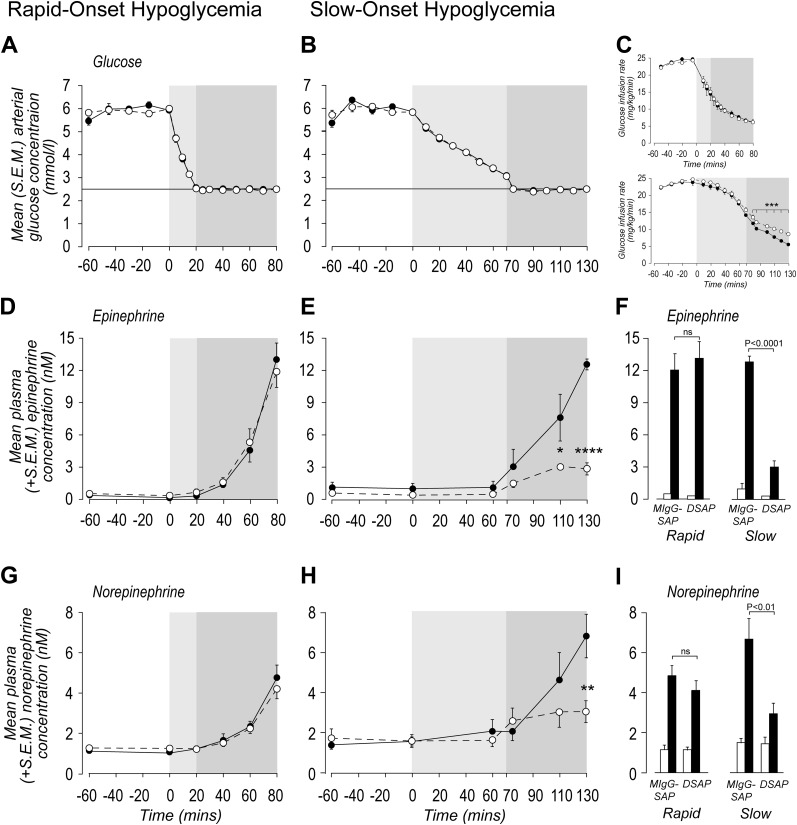
Figure 4.
Sympathoadrenal hormone responses to rapid- and slow-onset IIH. Panels A and B show the mean (SEM) arterial glucose concentrations in animals injected in the PVH with either a MIgG-SAP (solid circles) or a DSAP (open circles) and exposed to a rapid- or slow-onset hyperinsulinemic-hypoglycemic clamp. C: Corresponding glucose infusion rates. Plasma epinephrine (D–F) and norepinephrine (G–I) responses to the hyperinsulinemic-hypoglycemic clamps. F and I show the plasma epinephrine and norepinephrine concentrations at 0 min (open bars) and after 60 min (solid bars) of hypoglycemia. In all panels except F and I, the light gray area denotes the onset duration of hypoglycemia and the dark gray area denotes the duration of hypoglycemia (2.5 mmol/L). *P < 0.02; **P < 0.001; ***P < 0.0002; ****P < 0.0001; ns, not significant.

