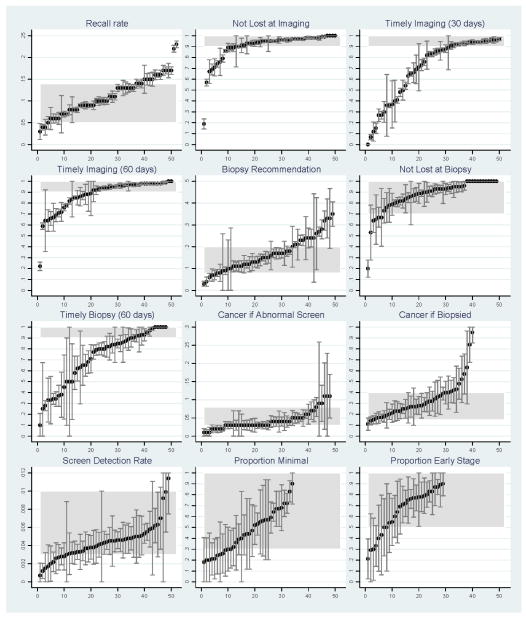
FIGURE 2.
Screening process measures and 95% confidence intervals for each institution, against benchmark ranges (shaded area). For each graph, facilities are ordered from smallest to largest value of the corresponding measure, therefore the ordering of specific facilities differs from graph to graph.

