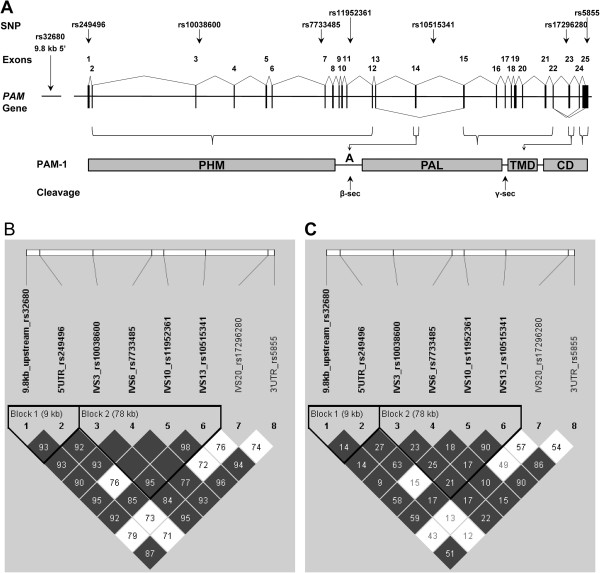
Figure 3.

SNPs in PAM. (A) Schematic of the PAM gene with loci of SNPs examined in this study. (B,C) Haploview LD plot for eight PAM gene SNPs with haplotype blocks identified using the four-gamete rule [26]. Darkened blocks indicate SNP pairs without evidence of extensive recombination (i.e. 4-gamete having a frequency < 0.01). (B) LD plot showing D’ - Values shown represent 100 × |D’|, empty boxes represent value of 100 (i.e. |D’| = 1). (C) Haploview LD plot showing R2 correlation values.
