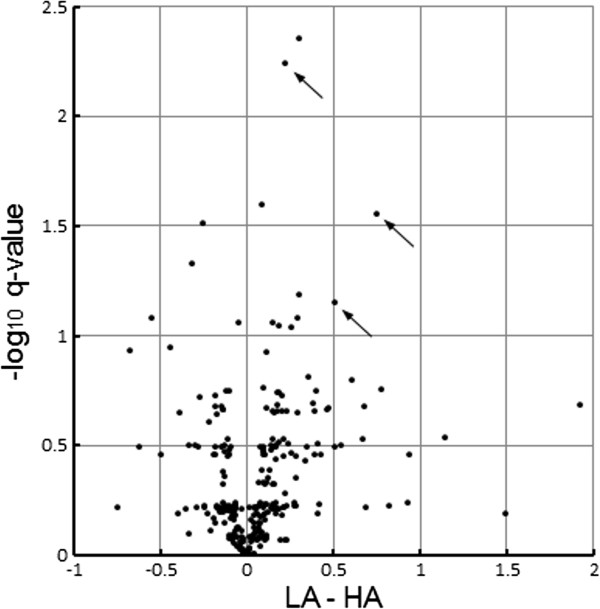
Figure 5.

Only a small fraction of miRNAs were regulated differentially by SNL nerve injury in HA compared to LA rats. In this “volcano plot” each dot represents one of the 284 miRNAs detected in the DRGs studied, with the degree of differential regulation (diff-reg, LA-HA) plotted against the statistical significance of the diff-reg (FDR corrected q-values, given as -log10). LA-HA was calculated as the difference between the mean log2 ratios of LA_SNL/LA_sham and HA_SNLl/HA_sham (average of pool values). Data used for the plot excluded outlier pool HA_SNL1. miRs 125b-5p, 30d-5p and 379-5p are indicated with arrows. The other significantly diff-reg miRNAs were expressed at low abundance (Table 1).
