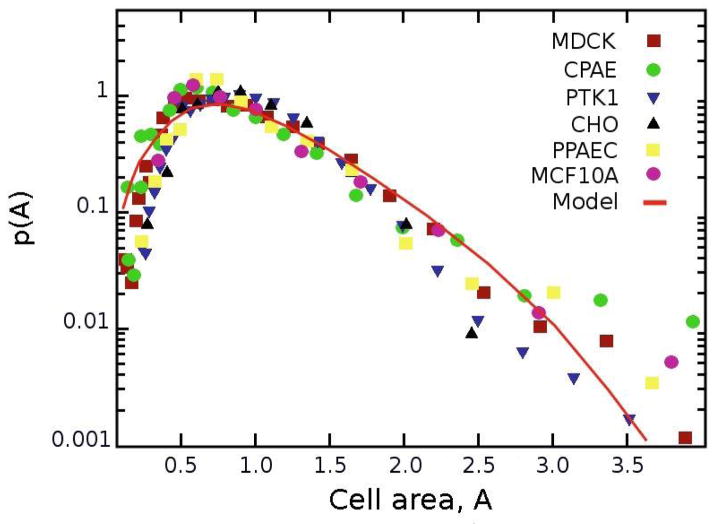
FIG. 2.
Distributions of cell areas from unpatterned monolayers on glass substrates. Markers give the probability distributions based on the experimental data (numbers of cells: NPtK1 = 1484, NCPAE = 1187, NMDCK = 1634) and images of cell monolayers found in the literature (NCHO = 226, NMCF 10A = 190, NPPAEC = 403). Cell areas are non-dimensionalized with respect to the average area of a cell in a monolayer, Aave. The line is based on the steady state model described in the main text with parameters derived directly from experiments (with μ = 0.7, σ = 0.5, non-dimensionalized cell areas Amax = 7.0, Amin = 0.4, and g = 0.5 hr−1).

