
Figure 1.
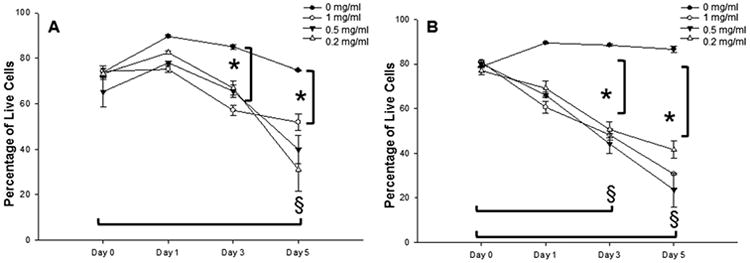
Percentage of live cells in mitomycin C-treated fibroblast cultures. (A and B) Show human normal vocal fold fibroblasts (nVFFs) and scarred vocal fold fibroblasts (sVFFs), respectively. Line and error bars represent means and the SEs of the data (n=4 for each group). *Denotes a statistically significant dose effect of that time point compared to 0 mg/mL. §Denotes a statistically significant time effect of all doses except 0 mg/mL compared to day 0.