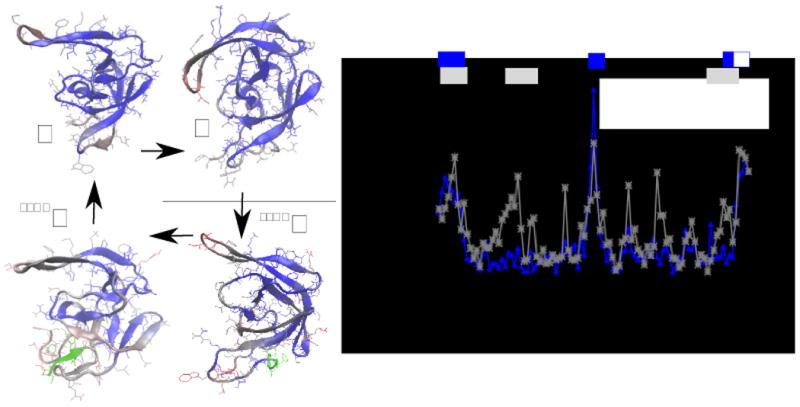
Figure 4.

on the left panel, the conformational difference between the average structure of the monomer (M), of the dimer (D), of the monomeric precursor (SFNFM) and of the dimeric precursor (SFNFD). The colors indicate the deviation of the position of each monomer of a structure from that of the structure indicated by the arrow (blue is small, red is large). The green part is the N-terminal tail which characterizes the precursor. On the right panel, the average deviation of the position of residues in conformations M and D (blue line) and in conformations SFNFM and M (gray line). The gray and blue bars on the top of the plot indicate the difference in chemical shifts for the same molecules observed in refs. 5 and 4, respectively. The white square indicates that the monomeric protease was deprived of residues 96-99.
