
Figure 7.
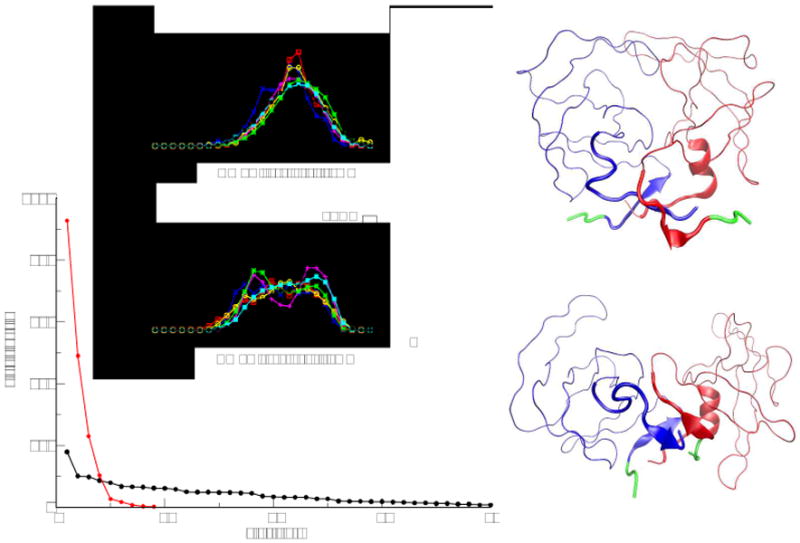
in the lower, left plot the distribution of cluster sizes obtained for the precursor (in black) and for the mature dimer (in red). Above, the distribution of RMSD of the N-terminal segments 1-5 of the dimer and of the precursor at increasing temperature, from 0.8Troom (blue curve) to 1.4Troom (in red). On the right, the average structures of the first two clusters found for the precursor.