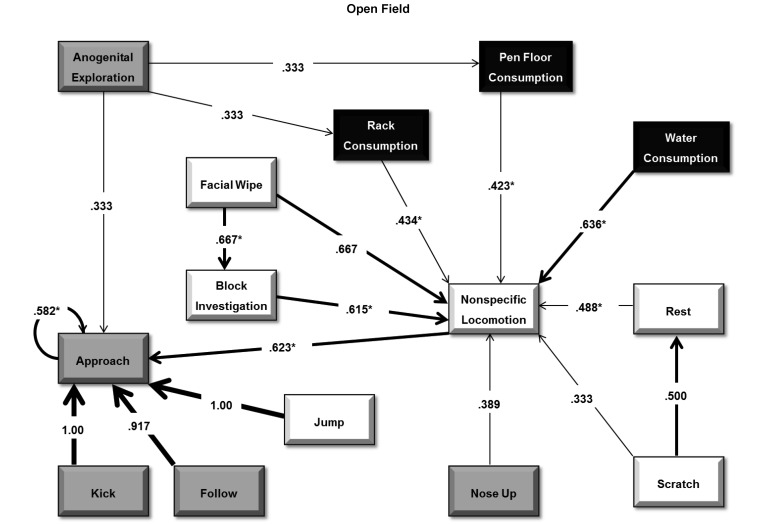
Figure 6.
Transition probabilities for observed behavior of Hartley guinea pigs in an open-field arena. The flow diagram depicts transition probabilities from one behavior to subsequent behaviors for Hartley guinea pigs during the open-field observation. Behaviors are grouped and highlighted according to the general categories: white for activity, black representing consumption, and gray for social interaction. Arrows depict the direction and strength of the probability of successive behaviors. Significant probabilities from Bonferroni-corrected P values are highlighted with an asterisk. Transition probabilities below 0.30 are not shown.

