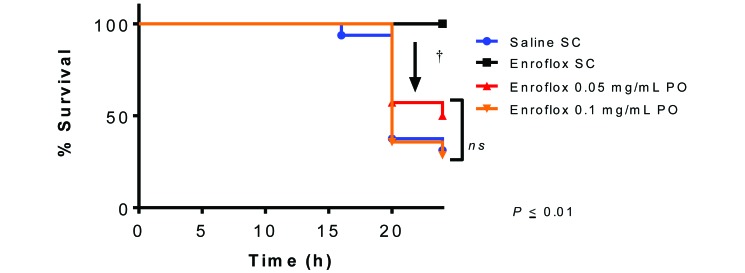
Figure 3.
Survival curve of antibiotic treated mice challenged with E. coli Xen 14. (n = 16 each for saline control group and enrofloxacin 5 mg/kg SQ, n = 14 each for enrofloxacin in drinking water at 0.05 and 0.1 mg/mL). Survival of group treated with 5 mg/kg SQ is significantly greater (†, P < 0.01) than all other groups.

