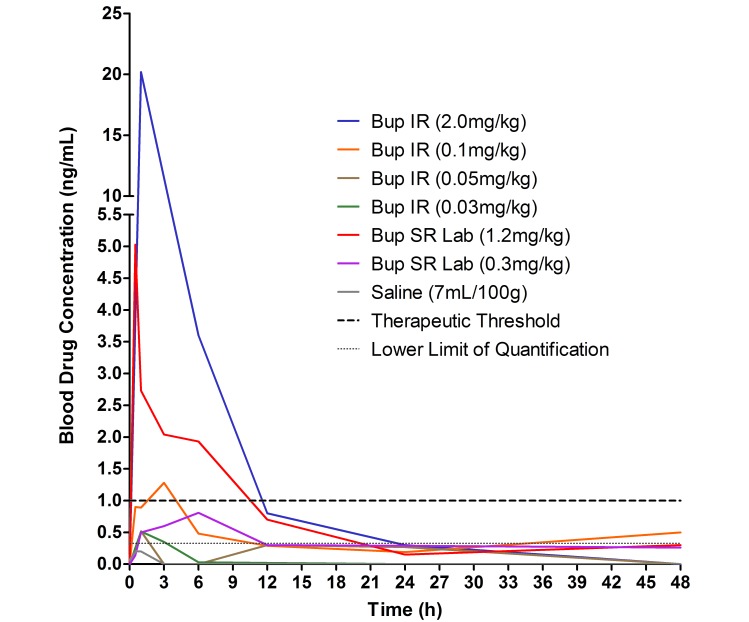
Figure 3.
This graph plots the buprenorphine concentration in blood of different buprenorphine formulations over 48 h. Horizontal dashed lines represent therapeutic threshold (1 ng/mL) and lower limit of quantitation (0.33 ng/mL). Values below the lower limit of quantification are extrapolated values.

