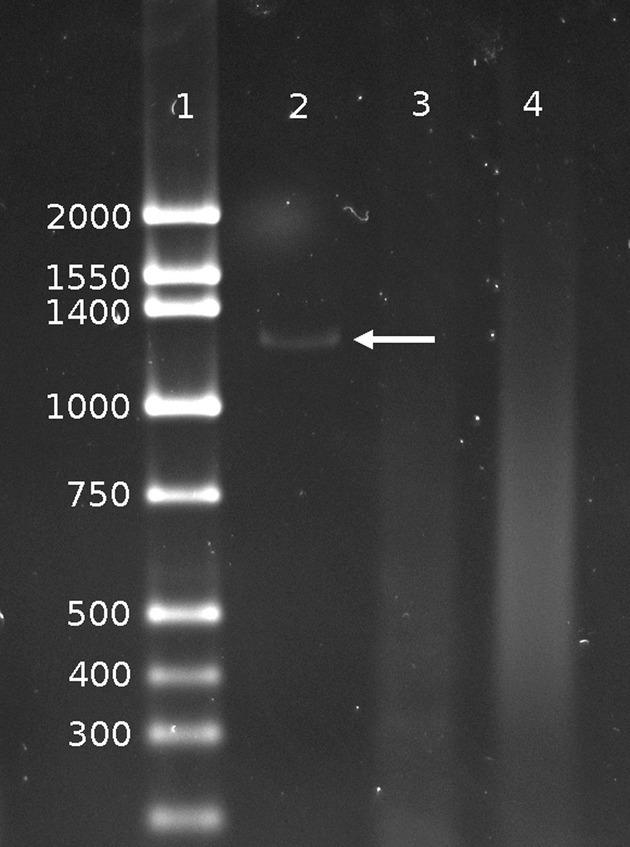
Figure 2.

PCR amplification across deletion breakpoint junction. Lane 1: DNA size marker ladder is shown with their sizes (bp). Lane 2: A 1.3-kb PCR product indicated by an arrow is generated using primers 5p1-F and 3p3-R (Table 2) with DNA isolated from the subject. Lane 3: No amplification was seen using primers 5p1-F and 3p1-R with the subject DNA indicating that primer 3p1-R is located within the deleted region. Lane 4: No PCR product was generated using the same primer set as in Lane 2 (5p1-F and 3p3-R) but, with control DNA which has no deletion.
