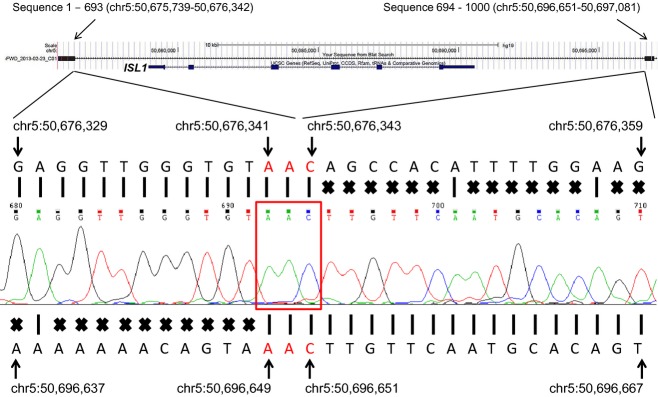
Figure 3.

DNA sequence across deletion breakpoint junction. A 1000 base DNA sequence from centromeric end of the 1.3-kb fragment was aligned using the Blat DNA sequence alignment tool from the UCSC Genome Browser (Top). ISL1 with 6 exons is shown in the Browser view. The DNA sequence was split into two parts and mapped onto two genomic loci indicated by black rectangles at both sides of the Browser view. The first 693 bases (sequence 1–693) mapped to chr5:50,675,739-50,676,342, and the following 307 bases (sequence 694–1000) localized to chr5:50,696,651-50,697,081. The electropherogram is shown in the middle of the figure with base calls shown in small colored letters directly above the electropherogram. Reference hg19 genomic DNA sequence at chr5:50,676,329-50,676,359 is presented above the electropherogram. Perfect DNA sequence alignments indicated by the vertical bars are seen at chr5:50,676,329-50,676,343. Sequence mismatches are depicted by “X” marks followed by the perfect alignments. Reference hg19 genomic DNA sequence at chr5:50,696,637-50,696,667 is shown at the bottom. Perfect DNA sequence alignments are observed at chr5: 50,696,649-50,696,667 after sequence mismatches (depicted by “X” marks). Genomic hg19 positions are indicated with arrows for some nucleotides. The sequence result confirms the “hybrid” DNA sequence which is generated by a 20,308 bp deletion via nonhomologous end joining mechanism. A microhomologous DNA sequence, “AAC”, surrounded by the red rectangle, is found at the junction point from both proximal and distal DNA fragments.
