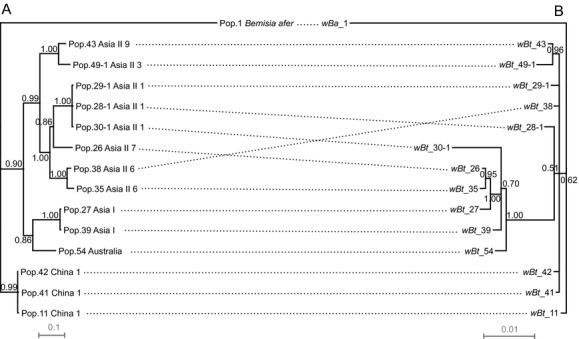
Figure 6.

Comparisons of Bemisia and Wolbachia phylogenies. A, the whitefly phylogeny constructed based on Bayesian analysis of mtCOI sequences (817 bp) as shown in Fig. A3 using TIM3 + I + G model. B, the Wolbachia phylogeny constructed based on Bayesian analysis of concatenated sequences of MLST genes (2079 bp) as shown in Table 1 using GTR + I + G model. Bayesian posterior probabilities are shown on the branches. Dashed lines connect hosts to their respective Wolbachia strains. The scale bar is in units of substitutions/site.
