Figure 1.

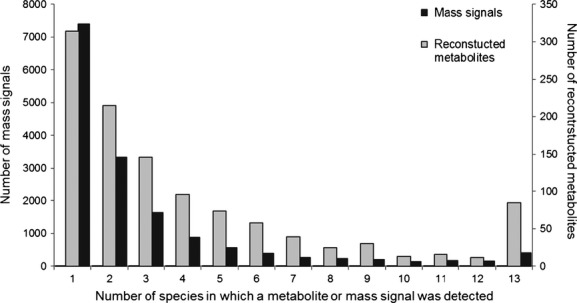
Diversity of metabolites in the 13 analyzed Asteraceae species. Frequency distribution of the mass signals (black bars) and reconstructed metabolites (gray bars).

Diversity of metabolites in the 13 analyzed Asteraceae species. Frequency distribution of the mass signals (black bars) and reconstructed metabolites (gray bars).