Figure 2.

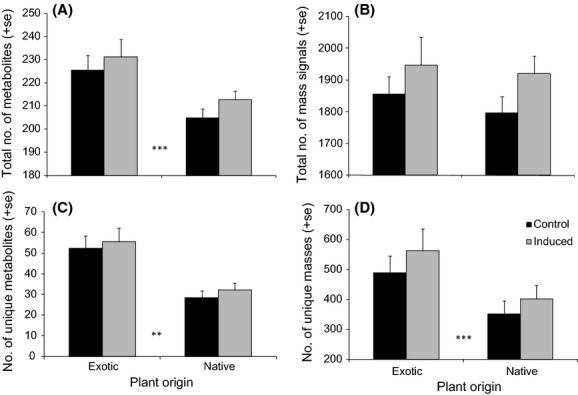
Number of metabolites in native versus invasive plants. Average total number of mass signals (A) and number of reconstructed metabolites (B), number of species-unique masses (C) and species-unique reconstructed metabolites (D) of exotic plants and native congeneric species. Induced plants (gray bars) received herbivory by Mamestra brassicae caterpillars. Control plants (black bars) were without herbivory. Plant origin differed significantly for total number of reconstructed metabolites, and unique number of mass signals and reconstructed metabolites (**P < 0.005, ***P < 0.0001, Table 2). Herbivory induced the total number of mass signals and reconstructed metabolites in both native and exotic plants (P < 0.05, Table 2). Error bars indicate standard errors of mean.
