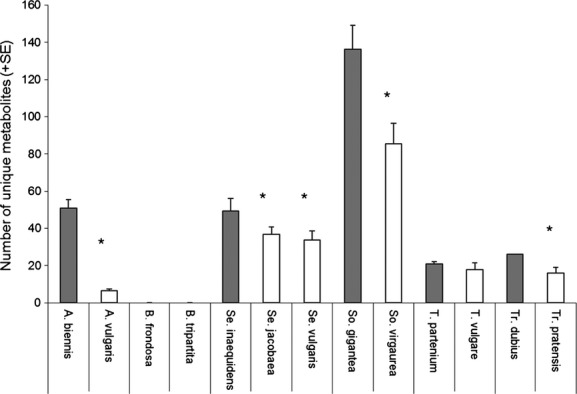
Figure 3.

Species-unique metabolites in native versus invasive plants per genus (Artemisia, Bidens, Senecio, Solidago, Tanacetum, Tragopogon). Average number (+SE) of unique metabolites per species in native and invasive plants in the control treatment without herbivory. Gray bars indicate exotic species, white bars indicate native species. Asterisks indicate significant differences between exotic and native species within the same genus (ANOVA, all P < 0.001).
