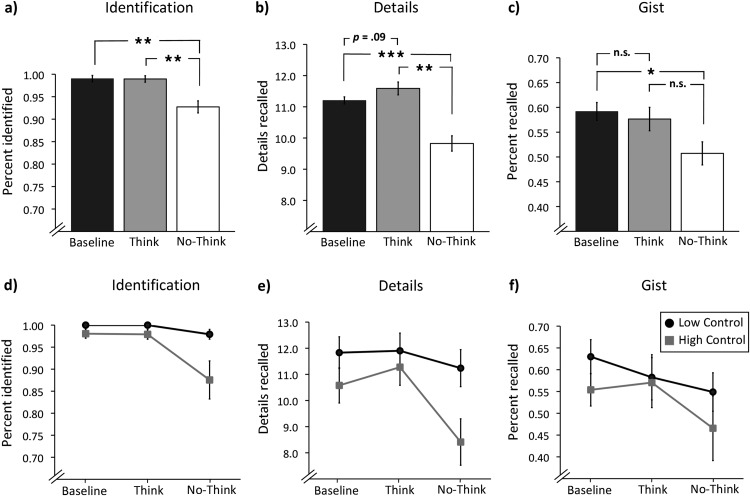
Figure 3.
Memory performance in the final test as a function of baseline, think, and no-think conditions. (a) Percentage of memories correctly identified, (b) absolute number of details correctly recalled, and (c) percentage of correct gist recall for n = 24 participants. Graphs d–f show memory performance separately for participants with lower (n = 12) and higher (n = 12) control over everyday intrusions for the (d) identification, (e) details, and (f) gist measures. Error bars indicate ±1 standard error of the mean. Significance levels are represented as follows: *p < .05. **p < .01. ***p < .001. n.s. = not significant.

