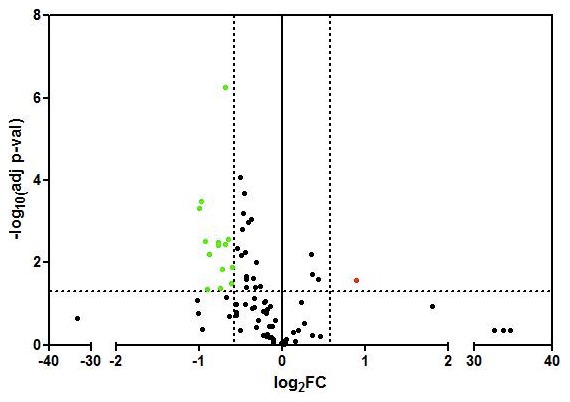
Figure 1. Vulcano plot comparing the 84 gene expression between the Her2+ and TNBC patinets.

The genes are represented as log2fold change based on -log10(adjp-value). According to the cut-off of 1.5 fold change (FC) and adjusted p-value of 0.05, the genes in green are underexpressed and the gene in red is overexpressed in TNBC patients compared to Her2+ patients.
