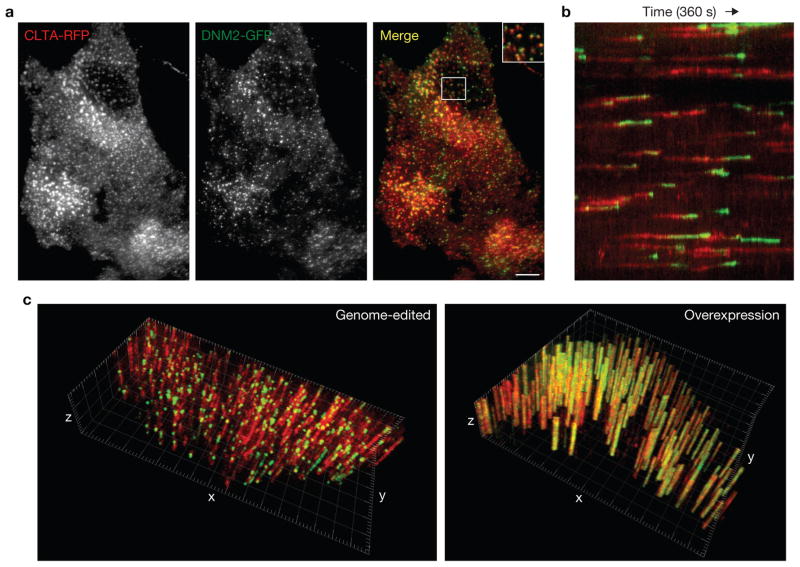
Figure 5.
Fluorescence microscopy analysis of the hCLTAEN/DNM2EN cell line. (a) TIRF microscopy image of the hCLTAEN/DNM2EN cell line expressing both CLTA–RFP and DNM2–GFP. The top right of merged image is a higher magnification view of indicated area. Scale bar, 10 μm. (b) Kymograph analysis of CLTA–RFP and DNM2–GFP fluorescence over time. (c) Three-dimensional kymograph analysis of the genome-edited hCLTAEN/DNM2EN cell line (left), compared with a SK-MEL-2 cell transiently overexpressing CLTA–RFP and DNM2–GFP (right). x–y plane (2.5 μm2 grid), cell plasma membrane; z axis, time (240 s, 2 s per slice).

