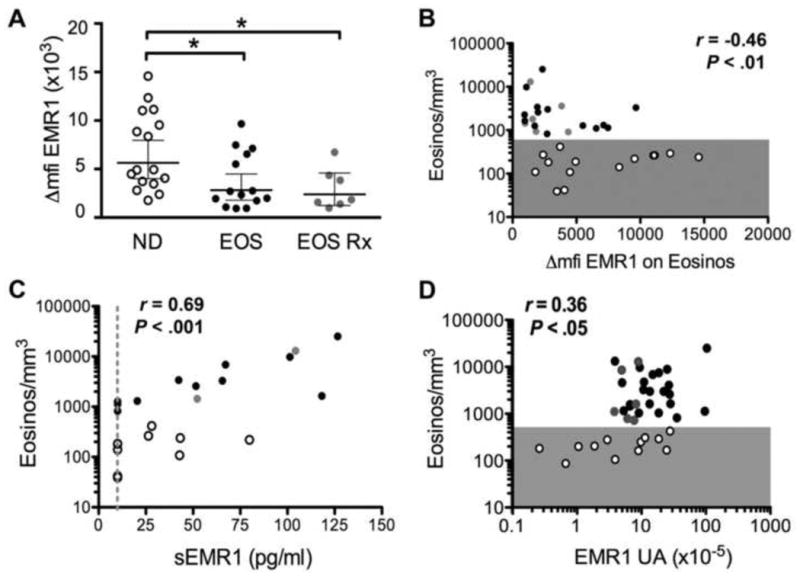
Figure 4. EMR1 expression in eosinophils is correlated with absolute eosinophil count.

(A) Surface expression of EMR1 on eosinophils in whole blood expressed as the change in mean fluorescence intensity (Δmfi) in normal donors (ND), untreated (EOS) and treated (EOS Rx) subjects with eosinophilia. Geometric means with 95% CI intervals are indicated by horizontal lines. *P <0.05 versus ND. (B-D) Correlation of surface expression of EMR1 (Δmfi), plasma levels of soluble EMR1 (in pg/ml), and EMR1 mRNA levels (expressed as arbitrary units relative to 18S rRNA) with AEC. AEC < 500/mm3 is indicated by gray shading. Each symbol represents data for an individual donor. Normal donors are indicated by open circles, eosinophilic subjects on no treatment by black circles and eosinophilic subjects on therapy by gray circles.
