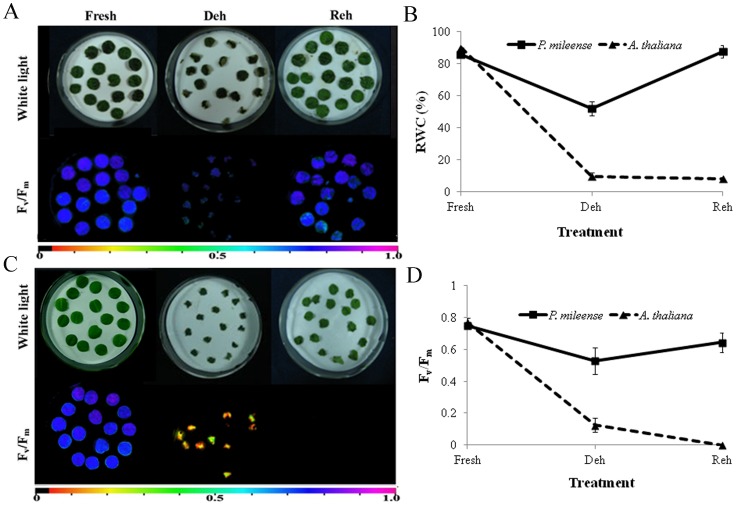
Figure 1. Dehydrated (Deh) and rehydrated (Reh) leaf discs of (A) P. mileense and (B) A. thaliana.
White coloration (upper picture) or low Fv/Fm values for variable fluorescence (lower picture). The color bar at the bottom indicates Fv/Fm values. (C) Relative water content (RWC). (D) Fv/Fm. Values are means ± standard deviation (n = 4 or 5).

