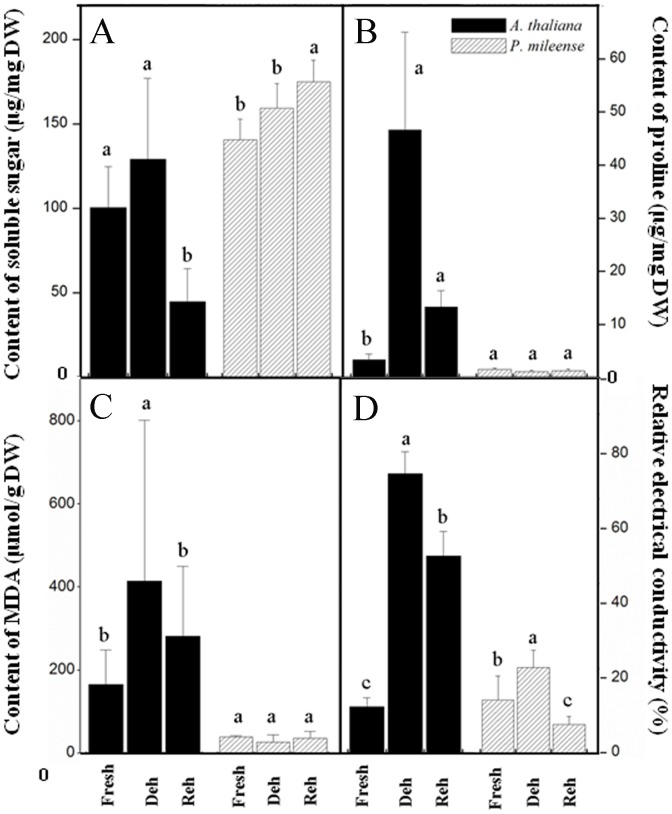
Figure 2. Changes in (A) soluble sugar, (B) proline, (C) malondialdehyde (MDA), and (D) relative electricity conductivity during dehydration (Deh) and rehydration (Reh) in P. mileense and A. thaliana leaves.
Values are means ± standard deviation (n = 4 or 5). Values in the same bar type with different letters indicate that values are significantly different (P < 0.05).

