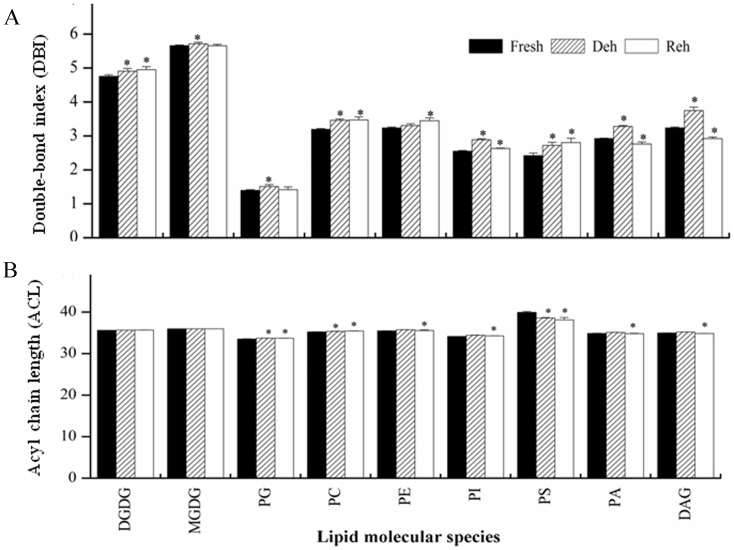
Figure 4. Changes in the (A) double-bond index (DBI) and (B) acyl chain length (ACL) of membrane lipids during dehydration (Deh) and rehydration (Reh) in P. mileense leaves.
 , where N is the total number of double bonds in the two fatty acid chains of each glycerolipid molecule.
  , where N is the total number of C atoms in the lipid molecular of each glycerolipid molecule. Bars with asterisks are significantly different (P < 0.05). Values are means ± standard deviation (n = 4 or 5).

