
Figure 9. Snapshots at the (A) beginning (0 ns) and (B) end (2 µs) of the simulation of the bilayer system.
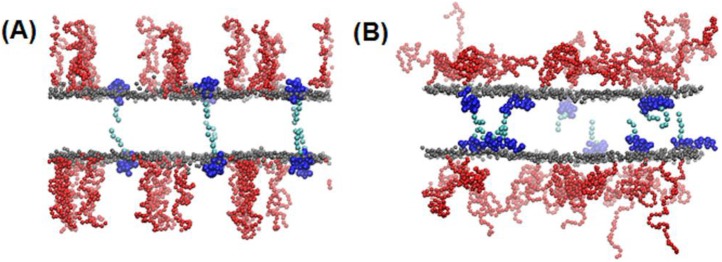
The molar ratio of liposome formulation is DPPC:DSPE-PEG:cholesterol:SA-Vn 55∶2∶15∶0.41. Gray, red, dark-, and light-blue colors respectively represent the lipid-head phosphate, PEG, ELP head (peptide), and tail (carbon chain) groups. For clarity, lipid tail, water, and ion beads are omitted. The images were created with Visual Molecular Dynamics [29].