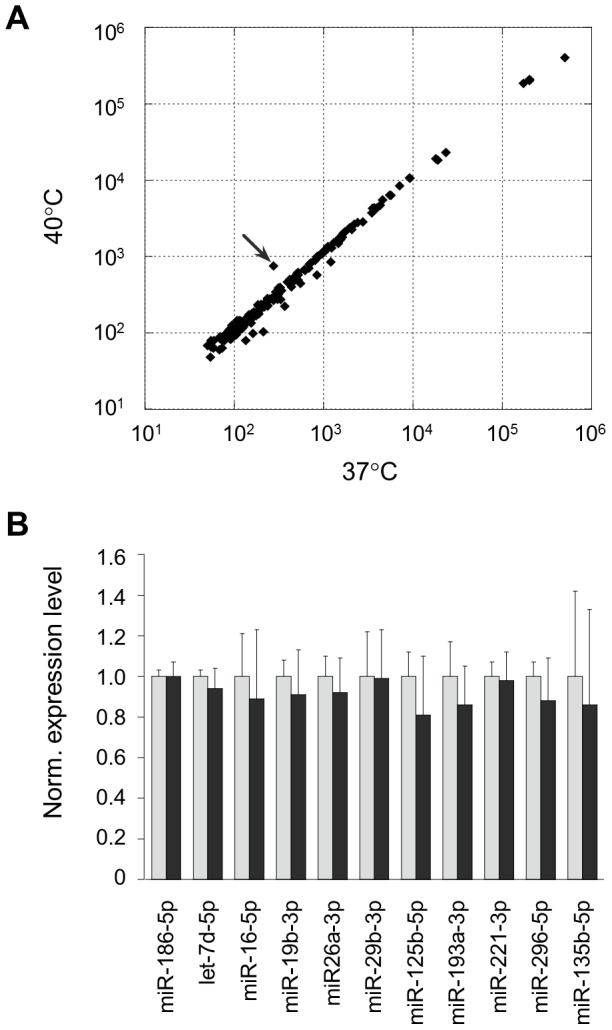
Figure 2. Expression profiles of miRNAs under normal and heat stress conditions.

(A) Expression profiles of miRNAs in HeLa cells that were exposed to a mild hyperthermia (40°C) as well as normal temperature (37°C) for 12 h were examined by means of the Genopal-MICH07 DNA chip. The expression profile data were compared to each other by scatter-plot graphs. The data were represented by hybridization signal intensities and indicated by arbitrary units. An arrow indicates miR-494 which looked like being upregulated in heat-shocked cells. The DNA chip analysis was duplicated with different samples and similar results were obtained. (B) RT-qPCR. To further confirm the expression data, RT-qPCR was carried out using newly prepared samples. The expression data were analyzed by the delta-delta Ct method using the data of miR-186-5p as a reference, which showed no significant difference in the gene silencing activity between naïve and heat-shocked cells (Fig. 1C), and further normalized to the data obtained from the normal temperature (37°C). The data are averages of three determinations, and error bars represent standard deviations. No significant difference between the 37°C (gray bars) and 40°C (black bars) data was detected by Student's t-test (two-tailed, p<0.05).
