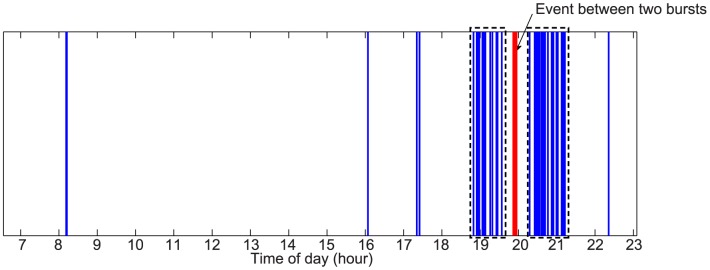
Figure 1. Example of event time series.

This example explains how the burst detection algorithm works. The algorithm correctly identifies the densest regions (black dashed boxes) avoiding to include the event in between (red solid line).

This example explains how the burst detection algorithm works. The algorithm correctly identifies the densest regions (black dashed boxes) avoiding to include the event in between (red solid line).